
Portland is a PR machine for light rail & streetcar
Here are Some Facts About Portland Oregon
“It must always be remembered how cost-effectiveness works in the public sector: the cost IS the benefit.” - author unknown
Portland's Light Rail Death Rate per 100 million passenger-miles
1987-2000
2001-2006
Totals (1987-2006)
year
1986
1
1987
35,046,300
1988
38,214,000
1989
35,934,000
1990
40,118,400
1
1991
43,598,400
2
1992
45,637,680
2
1993
45,215,760
1994
44,307,000
1995
46,538,760
1996
48,704,880
1997
52,971,480
1998
56,647,320
1
1999
100,859,280
4
2000
119,585,640
Total
753,378,900
11
year
2001
125,877,480
2
2002
144,919,080
2
2003
142,094,976
1
2004
158,275,716
1
2005
172,368,000
1
2006
169,552,280
1
Total
913,087,532
8
year
1987-2000
753,378,900
11
2001-2006
913,087,532
Total
1,666,466,432
19
In the 23 years since the first MAX line opened, there have been only two fatalities that police determined to be suicides. There have also been just "a handful" of attempts, Witt said.
Oregonian, March 13, 2009 http://blog.oregonlive.com/commuting/2009/03/toying_with_death_and_riding_a.html
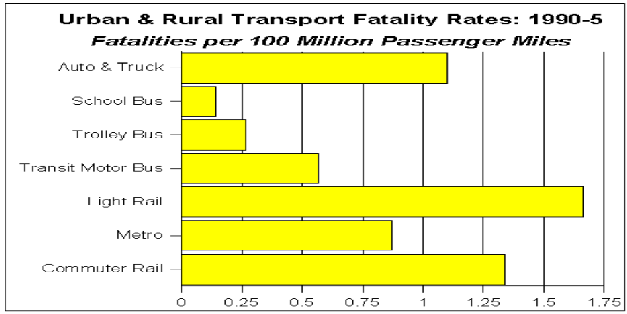
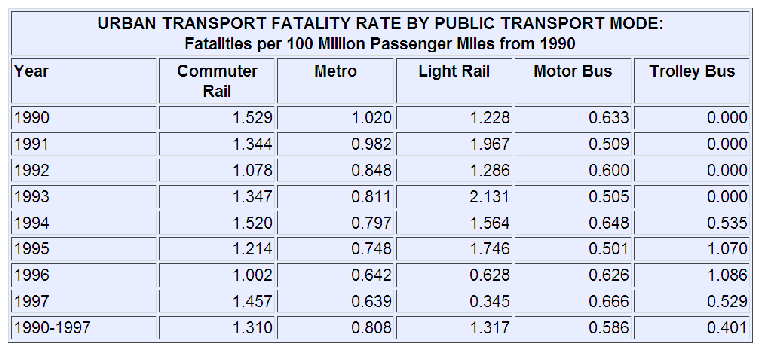
National Transportation Death Rates

| Bribery |
| Cheaper & Better Transit |
| EuroTranistShareLoss |
| Elderly Travel |
| GM & The Streetcar |
| Commute Time Chart |
| Top 10 Bus |
| Clackamas Public Safety |
| transit_congestion |
| McLoughlin Plan |
| CRC_Planning |
| Zoneing Increases Cost, Hurts Economy |
| High Rise |